WaveTalks Renuka Stock Review: 18th Aug 2024
Introduction
In this analysis, we will review Renuka stock using Elliott Wave Theory, focusing on the recent price movements and potential future trajectories. The analysis aims to provide a comprehensive outlook on the stock’s behavior and potential price targets based on wave counts and key technical levels.
Company Overview
Renuka is a significant player in the sugar industry, with a strong presence in both domestic and international markets. The stock has shown notable volatility, with significant price movements influenced by market trends, industry developments, and broader economic factors.
Current Market Context
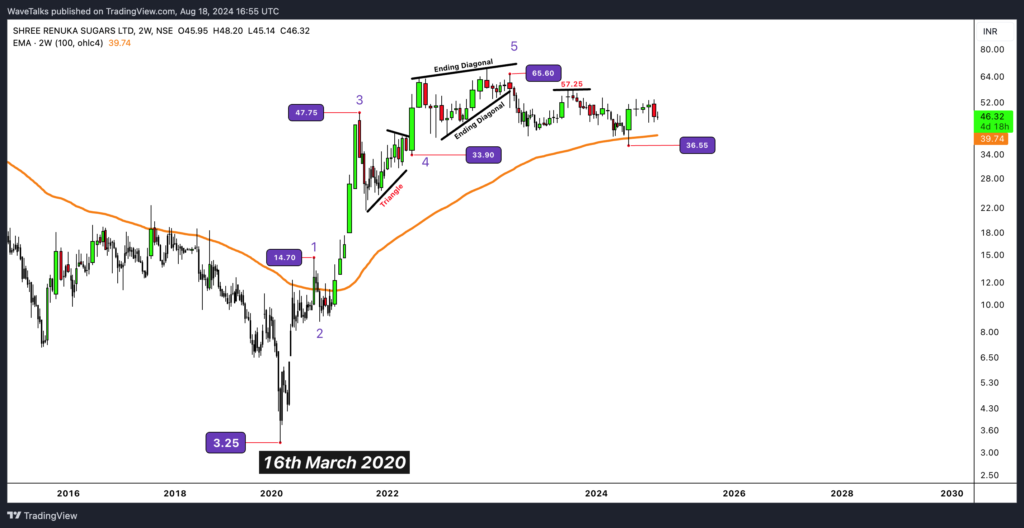
Since March 16, 2020, Renuka stock has exhibited a robust rally, rising from a low of ₹3.25 to a peak of ₹68.75 by December 19, 2022. However, after reaching a truncated wave 5 top at ₹65.60, the stock has entered a corrective phase, reflecting a broader market adjustment. Over the past 18 months, Renuka has retraced approximately 50% of its previous impulsive rise, stabilizing around the ₹35 level.
Technical Analysis Using Wave Theory
Primary Wave Count:
The impulsive wave structure from March 2020 to December 2022 appears to have completed a 5-wave sequence, culminating in a truncated fifth wave at ₹65.60. The subsequent corrective phase has seen the stock retrace to the 50% Fibonacci level, around ₹35, which coincides with a strong support zone (₹35-₹45).
- Support Zone: The zone between ₹35-₹45 is critical as it indicates potential accumulation. The stock appears to be gathering strength in this range, which could serve as a launchpad for the next impulsive move.
- Key Resistance Levels: The immediate resistance levels to watch are ₹54 and ₹57.25. A break above these levels would signify the end of the corrective phase and the beginning of a new impulsive wave.

Alternate Wave Count:
If the current support levels fail, and the stock breaks below ₹35, we might need to reassess the wave structure. However, given the strong support from the 100 EMA on the 2-week chart, this scenario appears less likely.
Price Projections:
Assuming a successful break above ₹57.25, the following upside targets are projected based on Fibonacci extensions:
- ₹75: Represents a 62% extension of the initial impulse (₹3.25 to ₹65.60).
- ₹98: Marks the 100% extension of the initial impulse.
- ₹137: A key target where the stock would achieve a 162% extension, aligning with the projected wave 3 of a higher degree.
These targets provide a roadmap for Renuka’s potential price movements in the coming months.
Risk Factors
The primary risk is the stock’s failure to break above the critical resistance at ₹57.25, which could indicate further consolidation or a deeper correction.
Conclusion
Renuka stock is currently in a pivotal accumulation phase within the ₹35-₹45 support zone. The critical resistance at ₹57.25 serves as a trigger for the next bullish wave, with potential targets at ₹75, ₹98, and possibly ₹137. Investors should watch for an impulsive rise from current levels, as it could signal the beginning of a significant uptrend.
Disclaimers
This analysis is based on Elliott Wave Theory and reflects current market conditions. Market analysis is subject to change, and investors should consider multiple factors before making investment decisions.
Share your thoughts and predictions in the comments section.
